

Part 1: The Structural Bull: Why This Uranium Cycle Is Different
Part one of a two part series based on my interview with Grant Isaac President of CAMECO Corporation
Uranium equities have had a strange few years. The stocks of major producers have surged, junior developers have attracted capital at valuations that would have seemed delusional a decade ago, and the long-term contract price has moved steadily upward without the violent reversal that ended every previous uranium bull market on record. Investors who lived through prior cycles keep waiting for the blow-off top. It has not come.

The standard explanation is that nuclear power is back. After a decade of retreating political support following Fukushima, governments across the western world have rediscovered that a 24-hour, carbon-free, energy-dense power source is not something you can replicate with wind turbines and battery storage. Reactor life extensions, phaseout reversals, a Chinese nuclear construction boom, and corporate power purchase agreements from data centre operators hungry for firm baseload have all landed within a compressed window. The demand story is real.
But demand alone does not explain why this bull has behaved so differently from its predecessors. Previous uranium cycles also had credible demand stories. The 2005-2011 bull had a nuclear renaissance narrative, a supply shock from the Cigar Lake mine flooding and China’s sovereign contracting program driving long-term prices. It still collapsed.
Understanding why this cycle may not follow the same script requires understanding something more fundamental: uranium is a commodity unlike any other, governed by market mechanics that have no real parallel in oil, gas, or industrial metals. The history of uranium investing is largely a history of analysts importing mental models from those markets and being destroyed by them.
Grant Isaac, President and COO of Cameco Corp and a former dean of the Edwards School of Business at the University of Saskatchewan, laid out that case in a recent conversation on Decouple. What follows draws on that interview as its primary analytical frame.
Why Uranium is an Unusual Commodity
The single most counterintuitive fact about the uranium market is that it has, in Grant Isaac’s framing, “basically zero fundamental in-year demand.” Every reactor currently operating will load its next fuel bundle from uranium that has already been procured. No utility anywhere on the planet is going into the market today to buy uranium it needs in the next 12 to 18 months. That material is already sitting in a warehouse, in a conversion facility, or moving through the enrichment and fabrication queue.
This inverts every intuition imported from oil markets. When oil demand rises, refiners buy more crude. When natural gas gets tight, utilities burn through spot supply and prices spike within weeks. The feedback loop between physical demand and price is immediate and visible. In uranium, that feedback loop is broken by design.
Utilities treat nuclear fuel as a long-lead procurement item. It is closer in spirit to steam generators or a reactor pressure vessel, ordered years in advance through carefully negotiated bilateral contracts, than buying natural gas. Global uranium demand currently runs around 175 million pounds per year. What passes for a spot market amounts to roughly 50 million pounds traded per year, of which utilities account for perhaps 10 million pounds of discretionary buying: outage adjustments, inventory top-ups, opportunistic purchases when price dips.
The real market is the bilateral term contract market, negotiated out of public view, and the price it produces can only be seen in the rear-view mirror rather than a windshield. It takes a week of negotiations to surface the spot price and a month of transaction volume to establish the term price. There is no real price discovery: no Bloomberg refresh, no live tick, no forward curve with the liquidity of an oil futures market. The uranium price is always, to some degree, a historical artifact.
This structure produces a distinctive and punishing cyclical pattern. Utilities do not bring forward demand to the market on a predictable annual schedule. They can go well below replacement contracting for years, drawing down existing inventory and long-term contract coverage, before returning en masse. Historically when they return, they all tend to arrive simultaneously, and the resulting demand surge hits a supply base that has had no signal to expand.
The uranium cycle runs 10 to 12 years on average, against something like potash’s 18 months, because the inventory buffer is deep and the procurement horizon long. A reactor running today has enough fuel in the core for 18 months and likely has one or two strategic reloads on site. European utilities have historically held roughly two years of forward inventory; Asian utilities typically hold three years or more.
A nuclear plant could theoretically run through a complete fuel cycle, reload from strategic inventory, and run another full cycle without a single uranium delivery arriving at the gate. No other commodity consumer operates with that kind of structural insulation, and it is precisely what enables buyer strikes lasting years and makes uranium demand, when it finally returns, arrive all at once.
Utilities do not contract for uranium in isolation either. They work backward through the fuel cycle: securing fabrication capacity first, then enrichment, then conversion, then uranium. You need to know where the uranium is going before you contract for it. This sequencing means uranium contracting always lags the broader nuclear procurement cycle. When conversion prices are at historic highs and enrichment contracting is strong, as both are right now, uranium demand is still building toward its own contracting surge. The uranium market is, in a structural sense, the last domino.
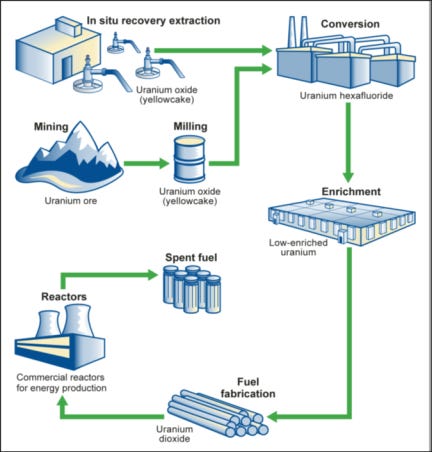
A Primer on Uranium Production
Not all uranium is created equal, and the method by which it comes out of the ground shapes much of its cost structure, its flexibility as a supply source, and its geopolitical character. There are three primary production methods worth understanding before examining the current supply picture.
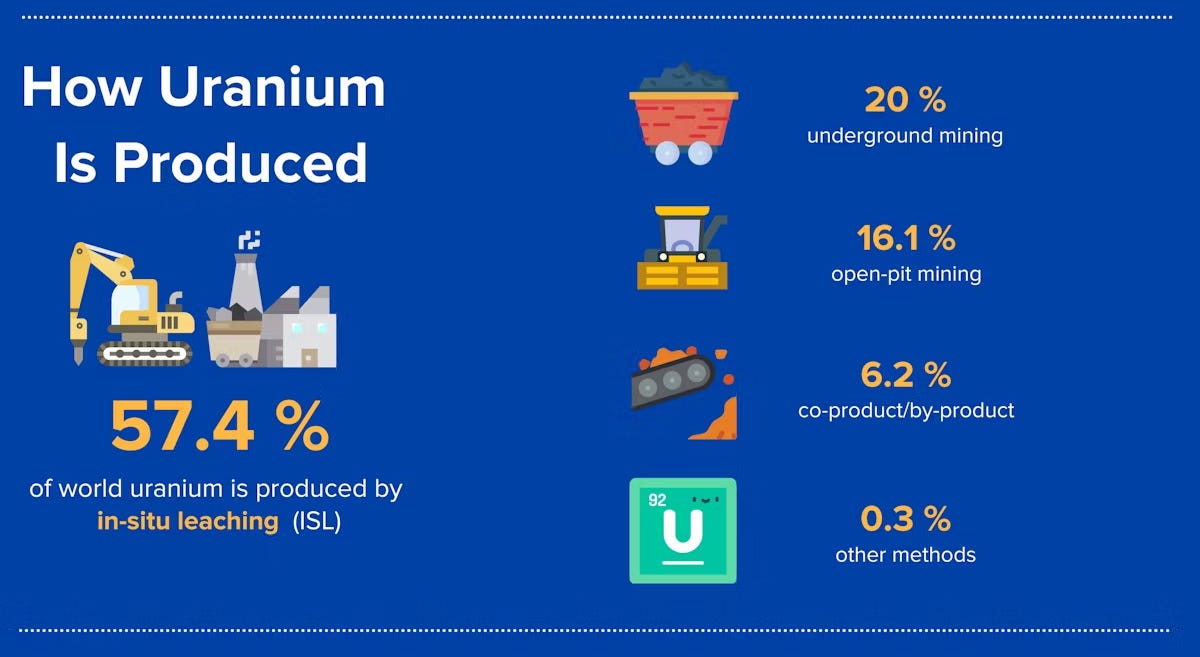
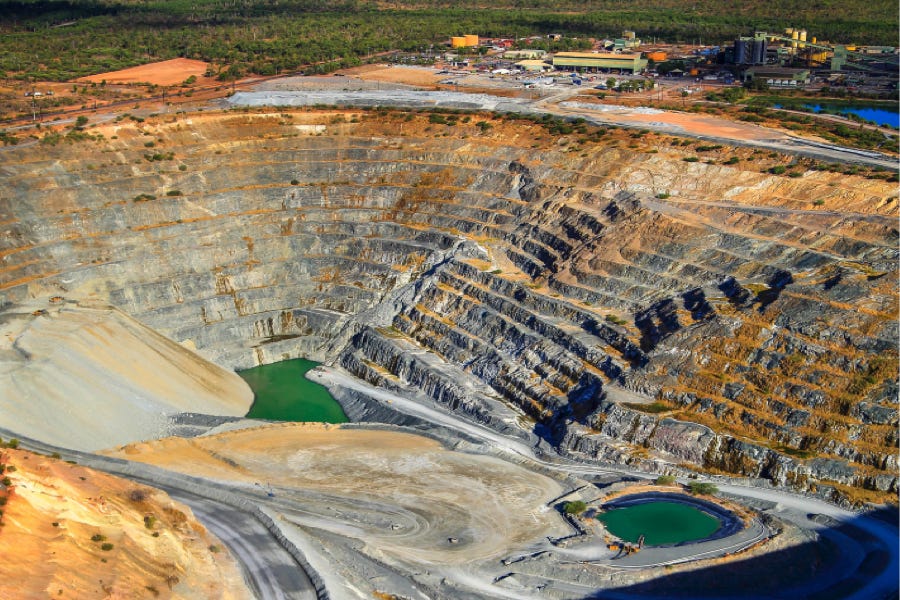
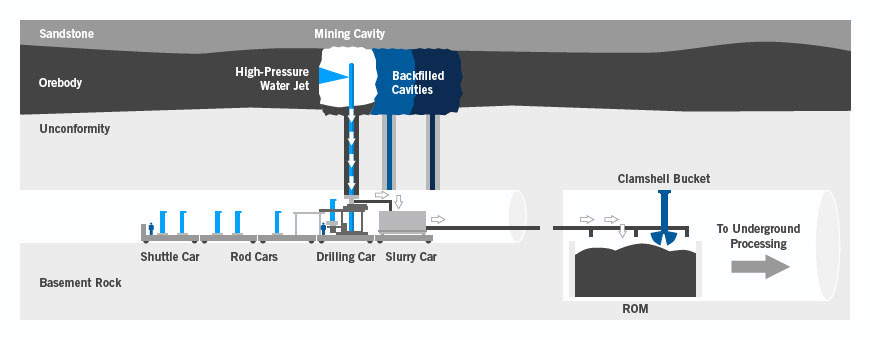
Open-pit mining is the simplest and historically the most throttleable: costs load heavily into variable rather than fixed, making it easier to idle when prices fall. Most of Africa’s uranium output has come from open-pit operations. Underground hard-rock mining carries enormous fixed infrastructure costs, which is precisely what makes Canada’s Athabasca Basin’s extraordinary ore grades necessary to justify the investment.
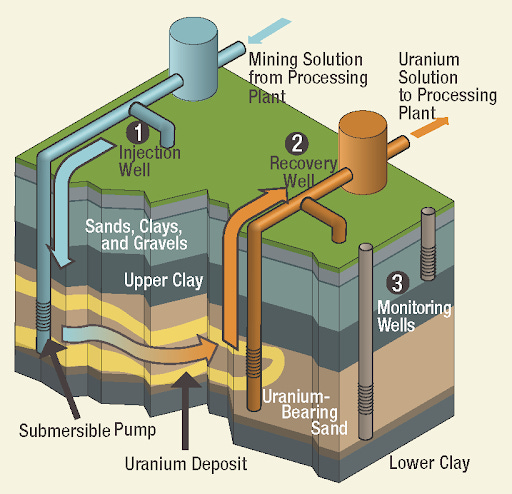
In situ leaching, or ISL, is what the late Bob Steane, Cameco’s longtime chief operating officer, called “plumbing, not mining.” No shaft is sunk, no ground is excavated. Injection wells push a lixiviant, a leaching solution, typically sulfuric acid or caustic soda through a bounded underground sandstone formation. The solution dissolves uranium from the host rock, gets pumped back to surface, and the uranium is precipitated out chemically. Capital requirements are a fraction of a conventional mine, the operation scales by drilling more wells and laying more pipe, and because you are working with permeable sandstone geology rather than hard basement rock, ISL can be economical at ore grades that would send a conventional miner packing.
Kazakhstan’s geology is almost perfectly suited to it: enormous bounded sandstone formations at manageable depths, with none of the freeze challenges or water management complexity that define Athabasca operations, and at a scale that makes every other ISL jurisdiction look like a pilot program. A large US ISR project produces around 200,000 pounds per year against global annual demand of roughly 175 million pounds. Scale is the entire economics of mining, and Kazakhstan has the denominator the US does not.
Then there is the Athabasca Basin. Picture it as a stone bowl: competent granite basement rock forming the bowl itself, fractured sandstone filling it. That sandstone holds enormous volumes of water that communicate across the entire formation through the fractures. The fracturing is also what concentrated the uranium in the first place: Over millions of years, oxidizing groundwater leached uranium from the overlying sandstone and carried it downward in solution. At the unconformity, where those oxidizing waters met reducing conditions in the basement rock, the uranium precipitated chemically and accumulated in extraordinary concentrations. However, the same geology that created the orebody makes extracting it so punishing.
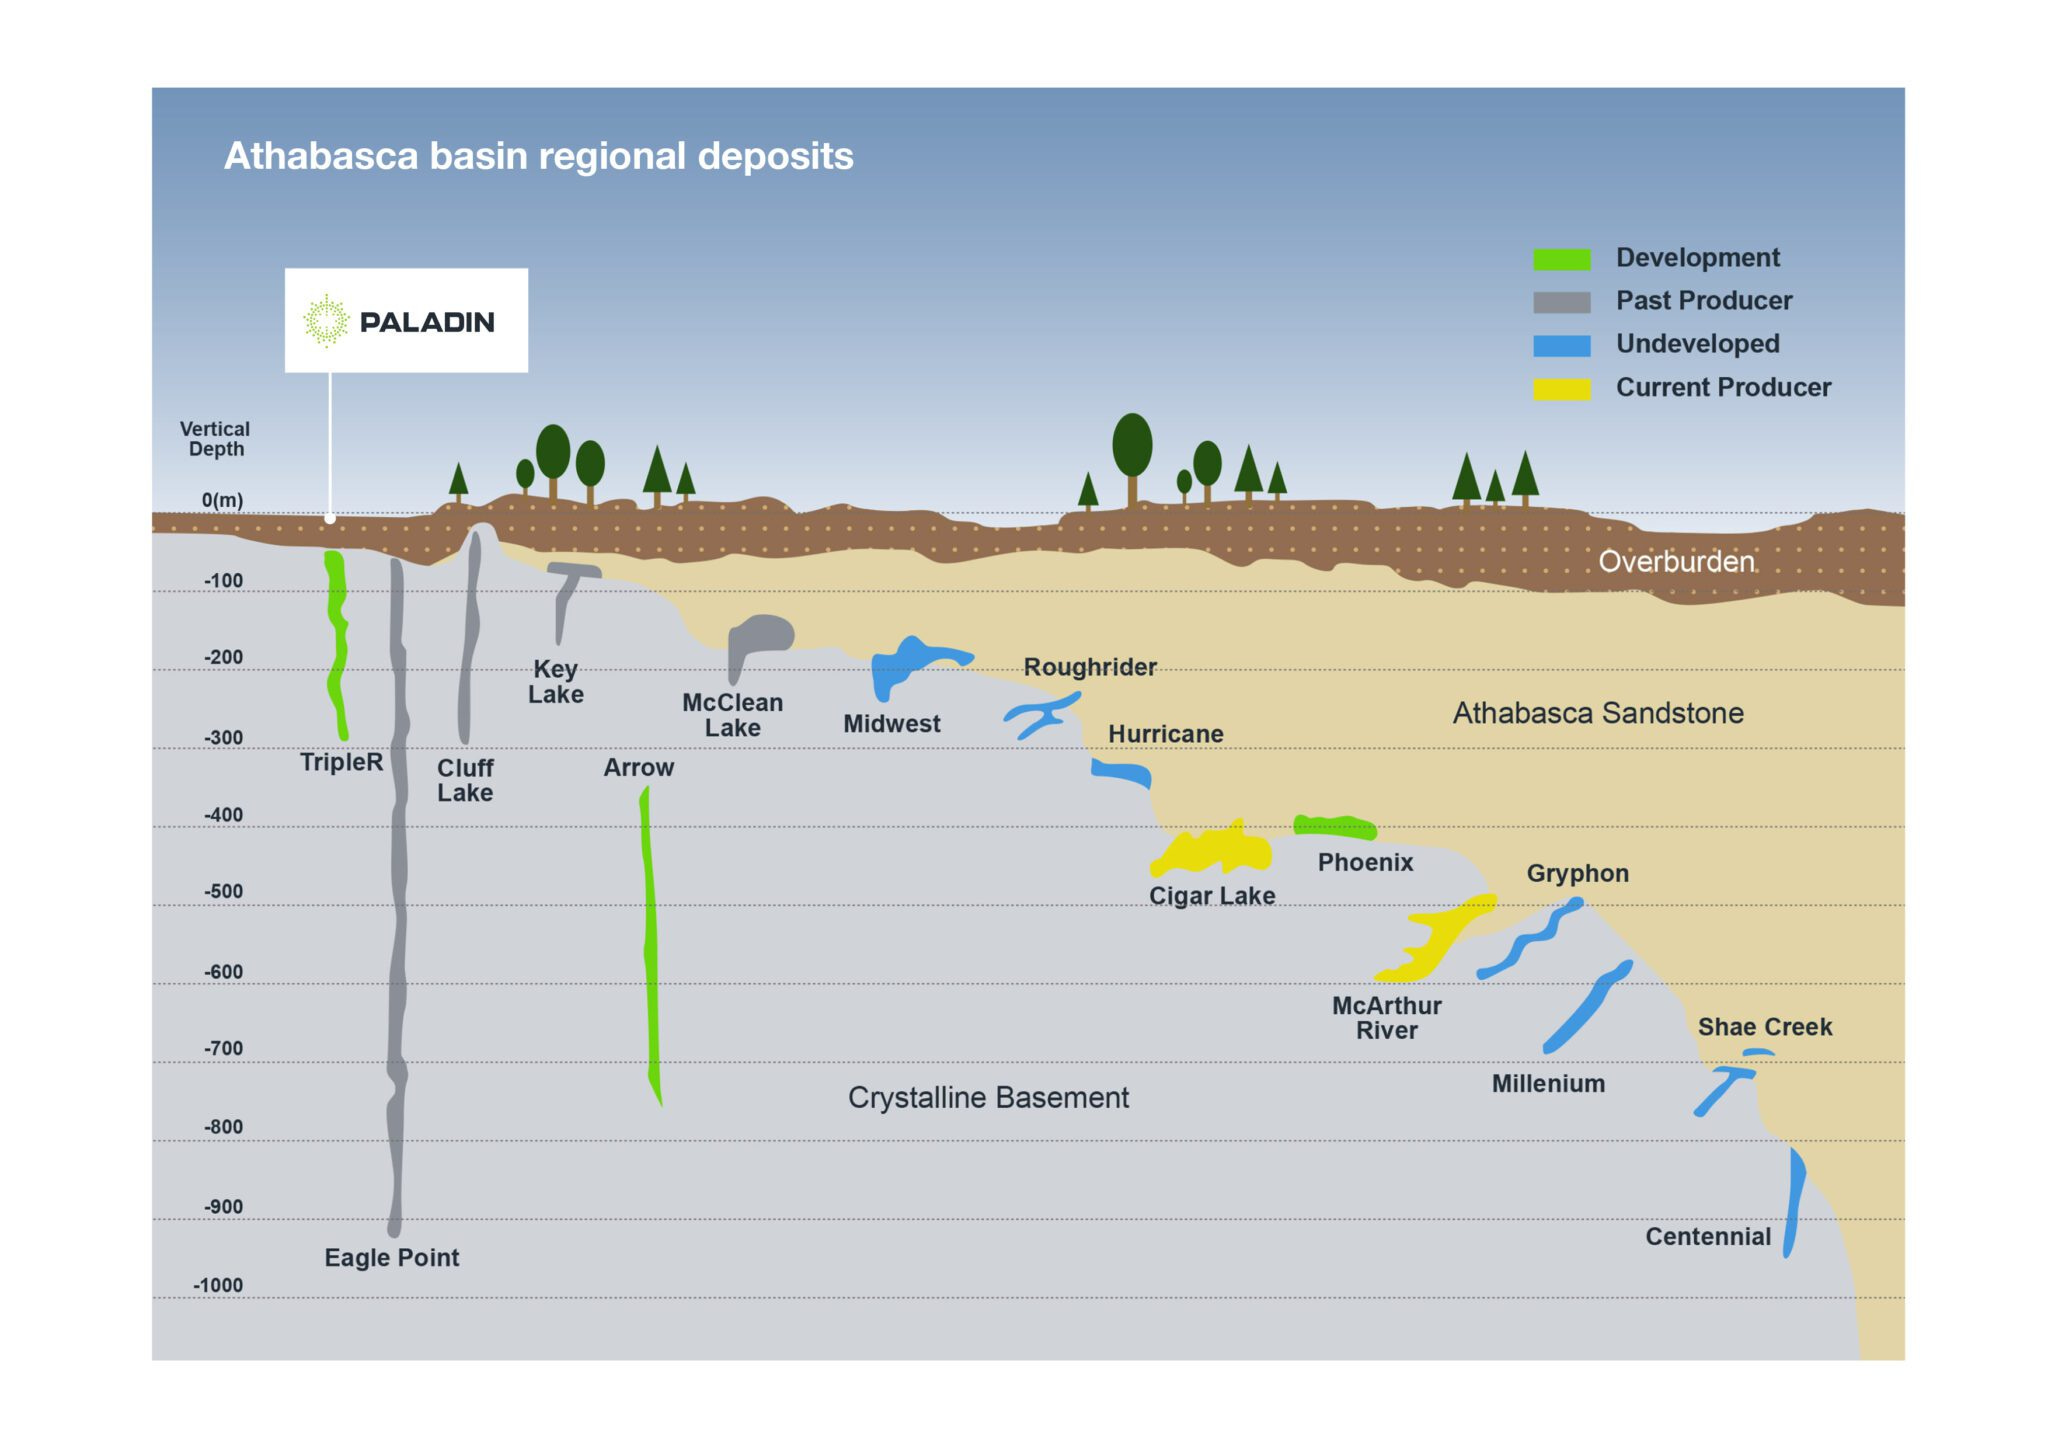
McArthur River sits where a geological anomaly allows most mining to take place in competent basement rock adjacent to the ore. Cameco drives freeze curtains outward from the granite into the surrounding sandstone, creating barriers against water inflow, then uses blasthole stoping with remote-operated scoop trams handling the highest-grade material to manage radiation exposure.
Cigar Lake, just 55 kilometres away, presents a completely different problem: the ore sits at the top of a clay funnel at the unconformity and the geology makes working from above impossible. All operations are conducted below the ore body. Cameco bulk-freezes the entire ore zone from the surface, then bores upward into the frozen material using high-pressure water jets, collecting the resulting uranium slurry through steel pipes feeding into processing circuits below. In both cases without the freeze, the operation does not exist.
The ore grades are what make this extraordinarily complex mining engineering worthwhile. Cigar Lake averages around 15% uranium by mass, having peaked at 18% early in its mine life. McArthur River runs 7 to 8% now. The global average uranium ore grade is under 0.1%. Individual ore passes at Cigar Lake have been recorded at 70% uranium. That grade advantage is the economic justification for every dollar spent on frozen ground, remote operations, and decades of institutional learning about water management in fractured sandstone.
The concentration of production that results is striking. Ghawar, the largest conventional oilfield ever found, supplies around 6% of global oil. Cigar Lake alone supplies 14% of global uranium. McArthur River at full licensed capacity adds another 10 to 13%. Two mines in the same basin in northern Saskatchewan, both accessible only by winter road, account for roughly a quarter of all primary uranium production on earth.
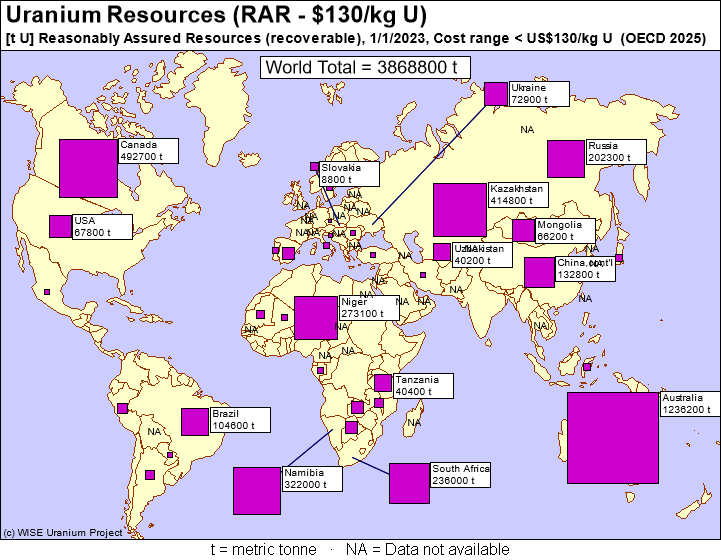
That concentration also explains why the IAEA’s Red Book figure showing Australia with the world’s largest uranium resources is less reassuring than it appears: a resource is uranium believed present based on geological evidence, while a reserve is what remains after asking whether the ore can be extracted at today’s prices and sold at a margin. When that model is applied, the global supply picture narrows considerably. Large numbers in the Red Book are not the same as commercially-available pounds.
A history of uranium cycles
The uranium market has a pattern, and it has repeated with enough consistency that understanding it is the prerequisite for evaluating any claim that this time is different.
Every bull market in uranium history has ended the same way: either a demand destruction shock or a supply flood killed it, and in both cases the ensuing bear market was then sustained and deepened by a vast overhang of secondary supply that took decades to work through. It is the fact that the overhang is now gone that is the structural break. But to appreciate why it matters, you have to see how it functioned across 6 decades of cycles.

The originating myth is Eisenhower’s Atoms for Peace speech and Lewis Strauss’ claim of nuclear power “too cheap to meter.” This seeded an expectation not of hundreds of reactors but thousands.
On the strength of that expectation, uranium was explored for, discovered, and produced at scale well before the demand existed to absorb it. Around 650 reactors eventually came into operation globally, not the 2,000 or more that had been projected, and the surplus from that miscalculation would shadow the uranium market for the next 6 decades as “secondary supply” (defined more broadly as material from stockpiles, military programs, and reprocessing) competed with freshly mined uranium.
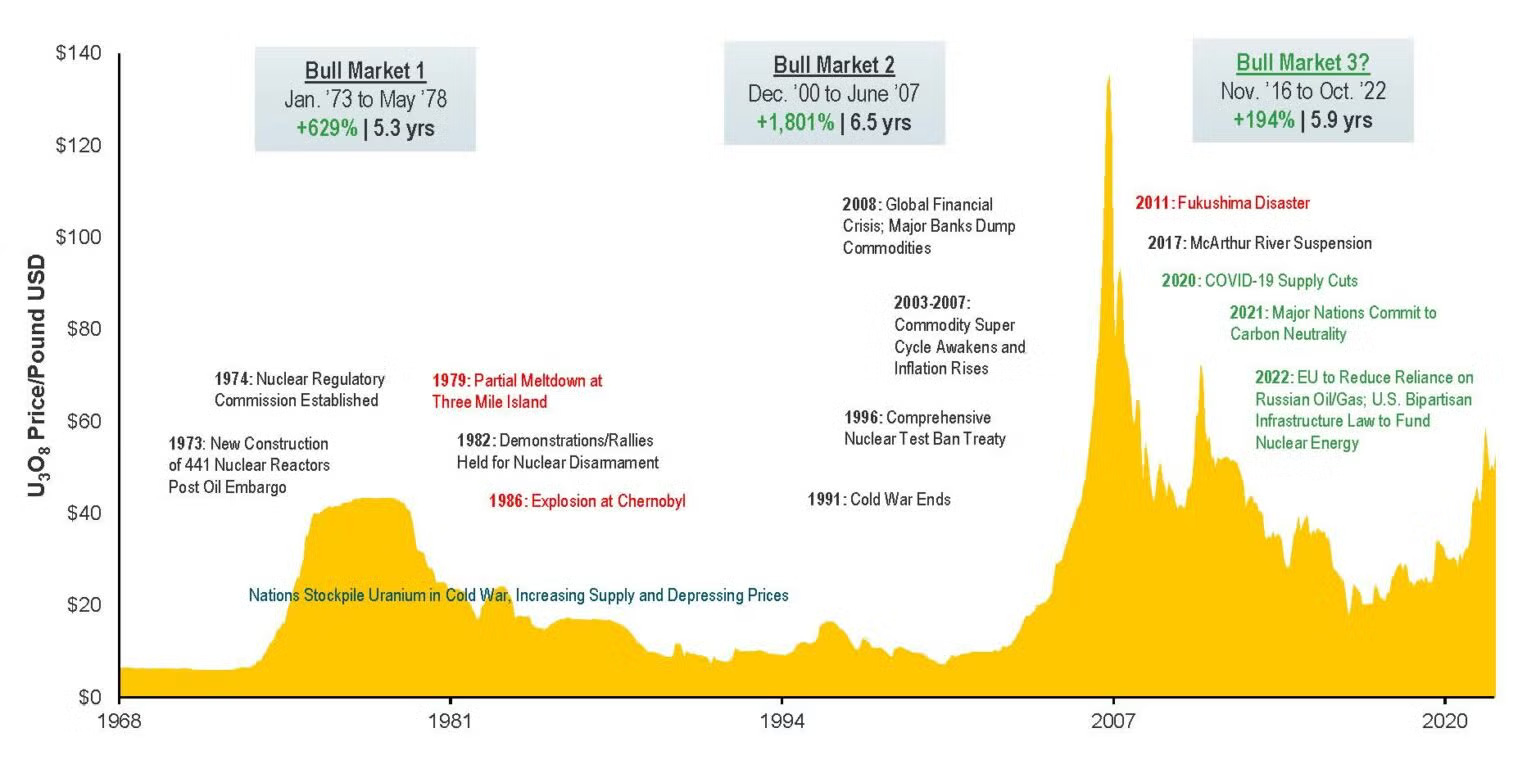
Three Mile Island in 1979 and Chernobyl in 1986 compounded a demand collapse that had already begun: reactor orders had peaked in 1974 and were in freefall with more than 120 US reactor orders ultimately cancelled. Public opposition hardened across western Europe, and utilities with contracted material they no longer needed sold into a market with nowhere for the pounds to go.
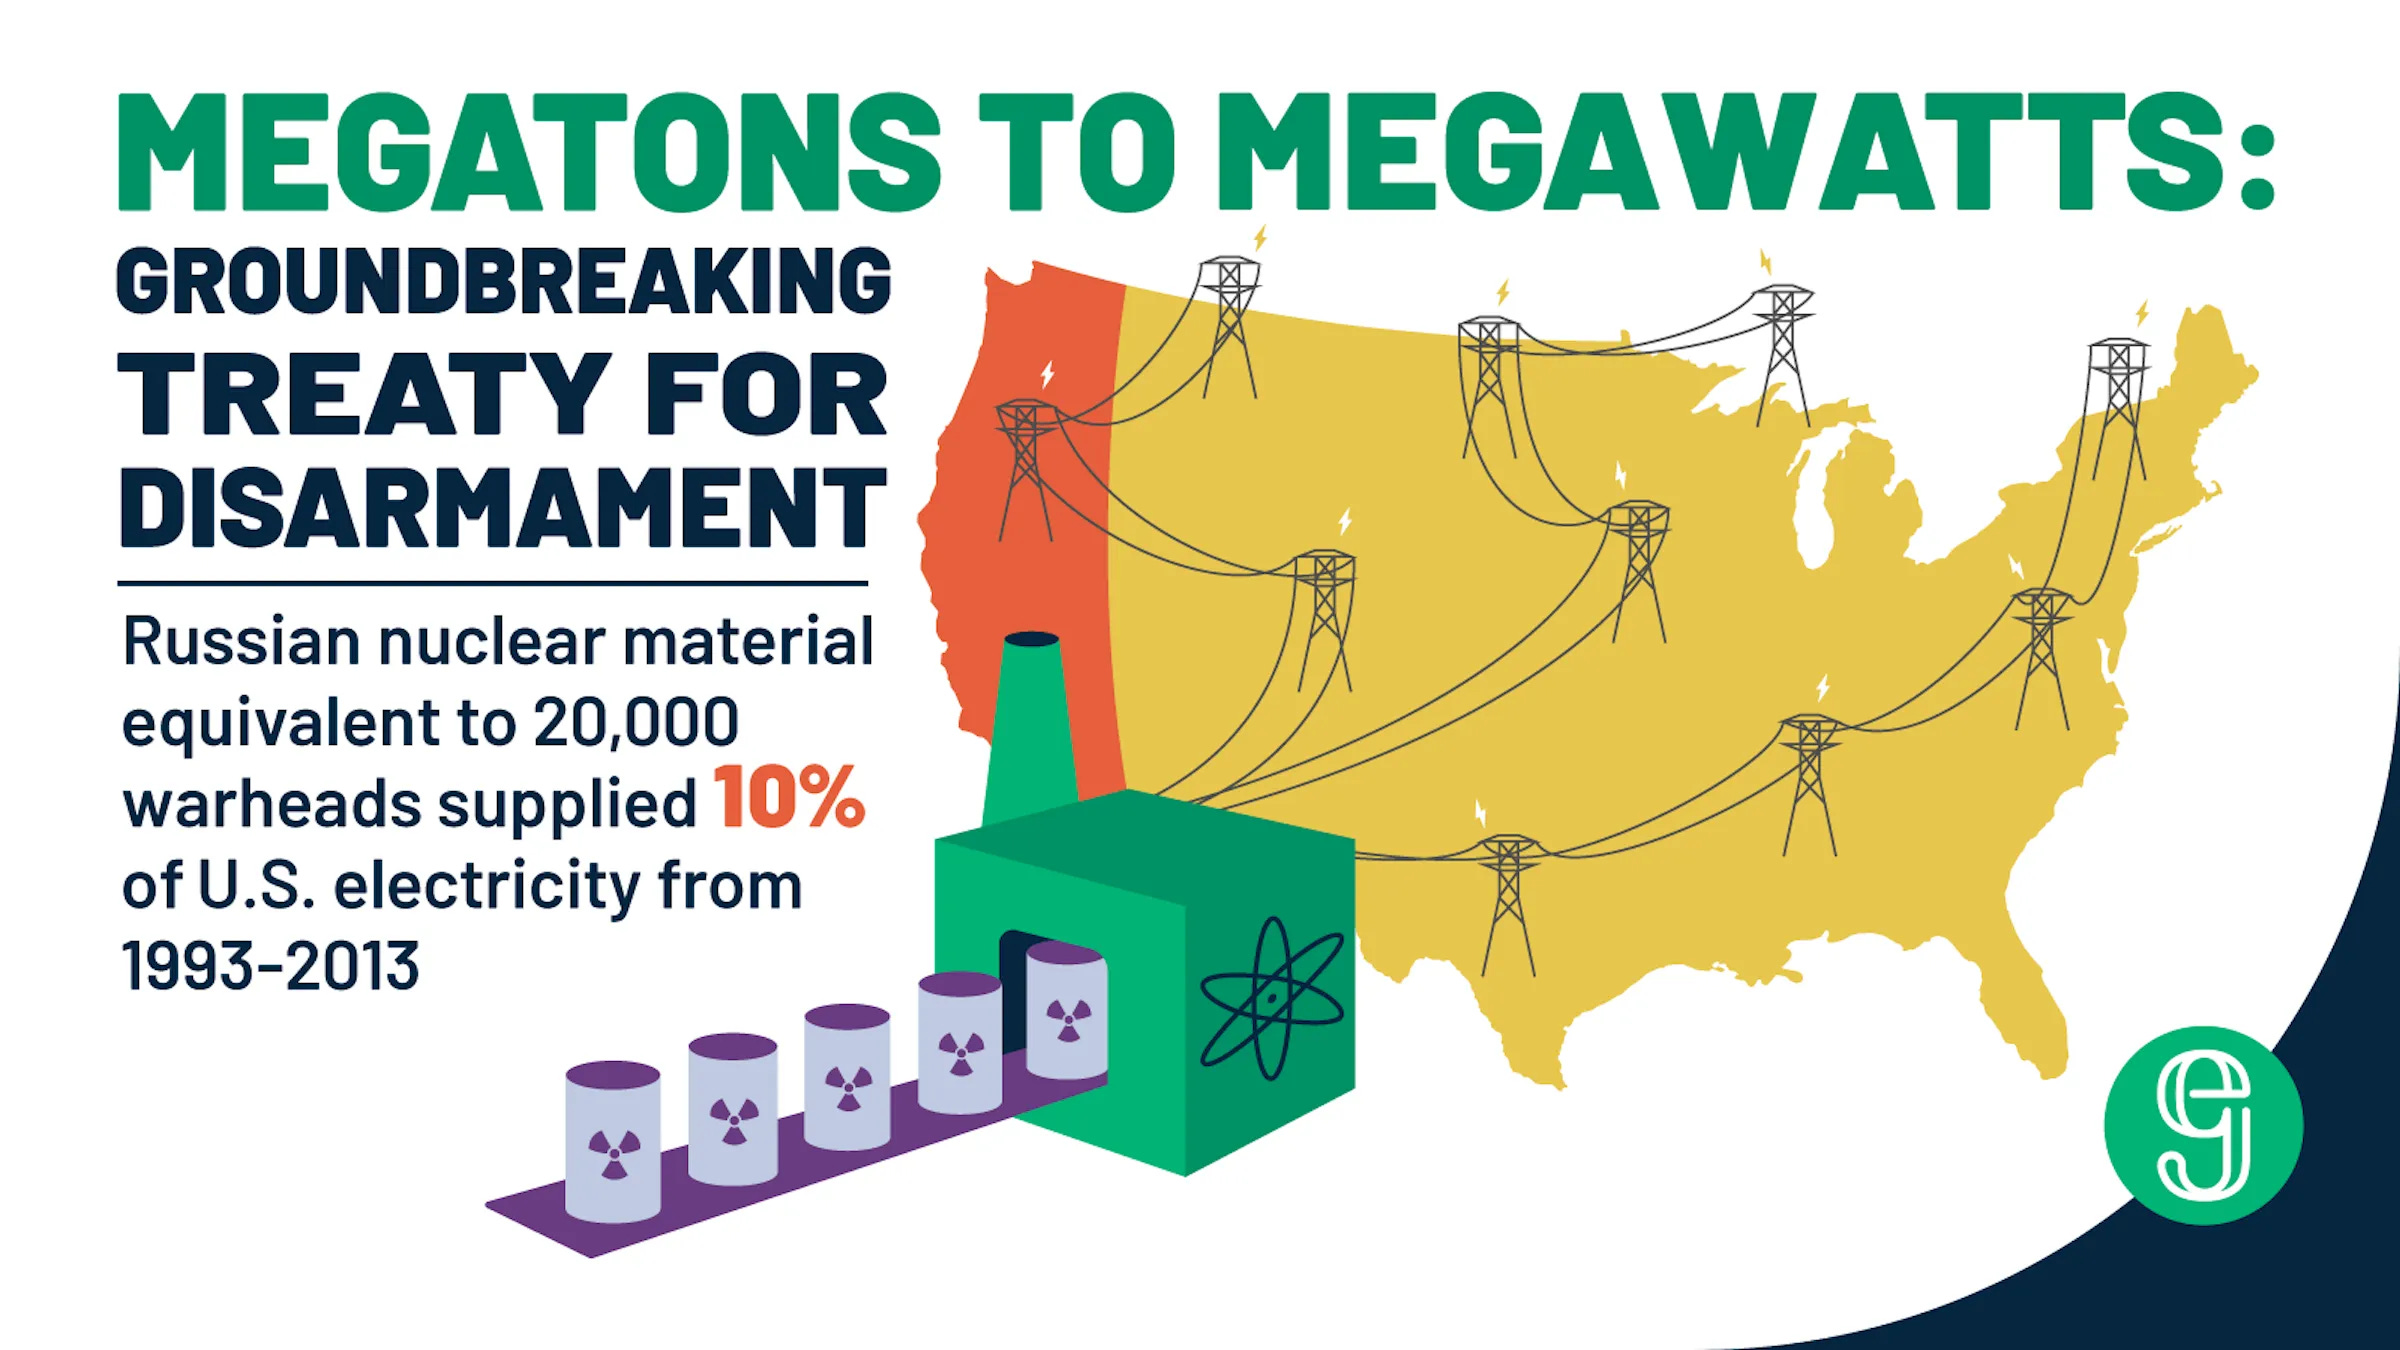
Then the Cold War ended and a new source of secondary supply entered through the megatons-to-megawatts program, which down-blended 500 metric tonnes of Russian highly enriched uranium into low-enriched uranium and fed it into western civilian power markets over 20 years.
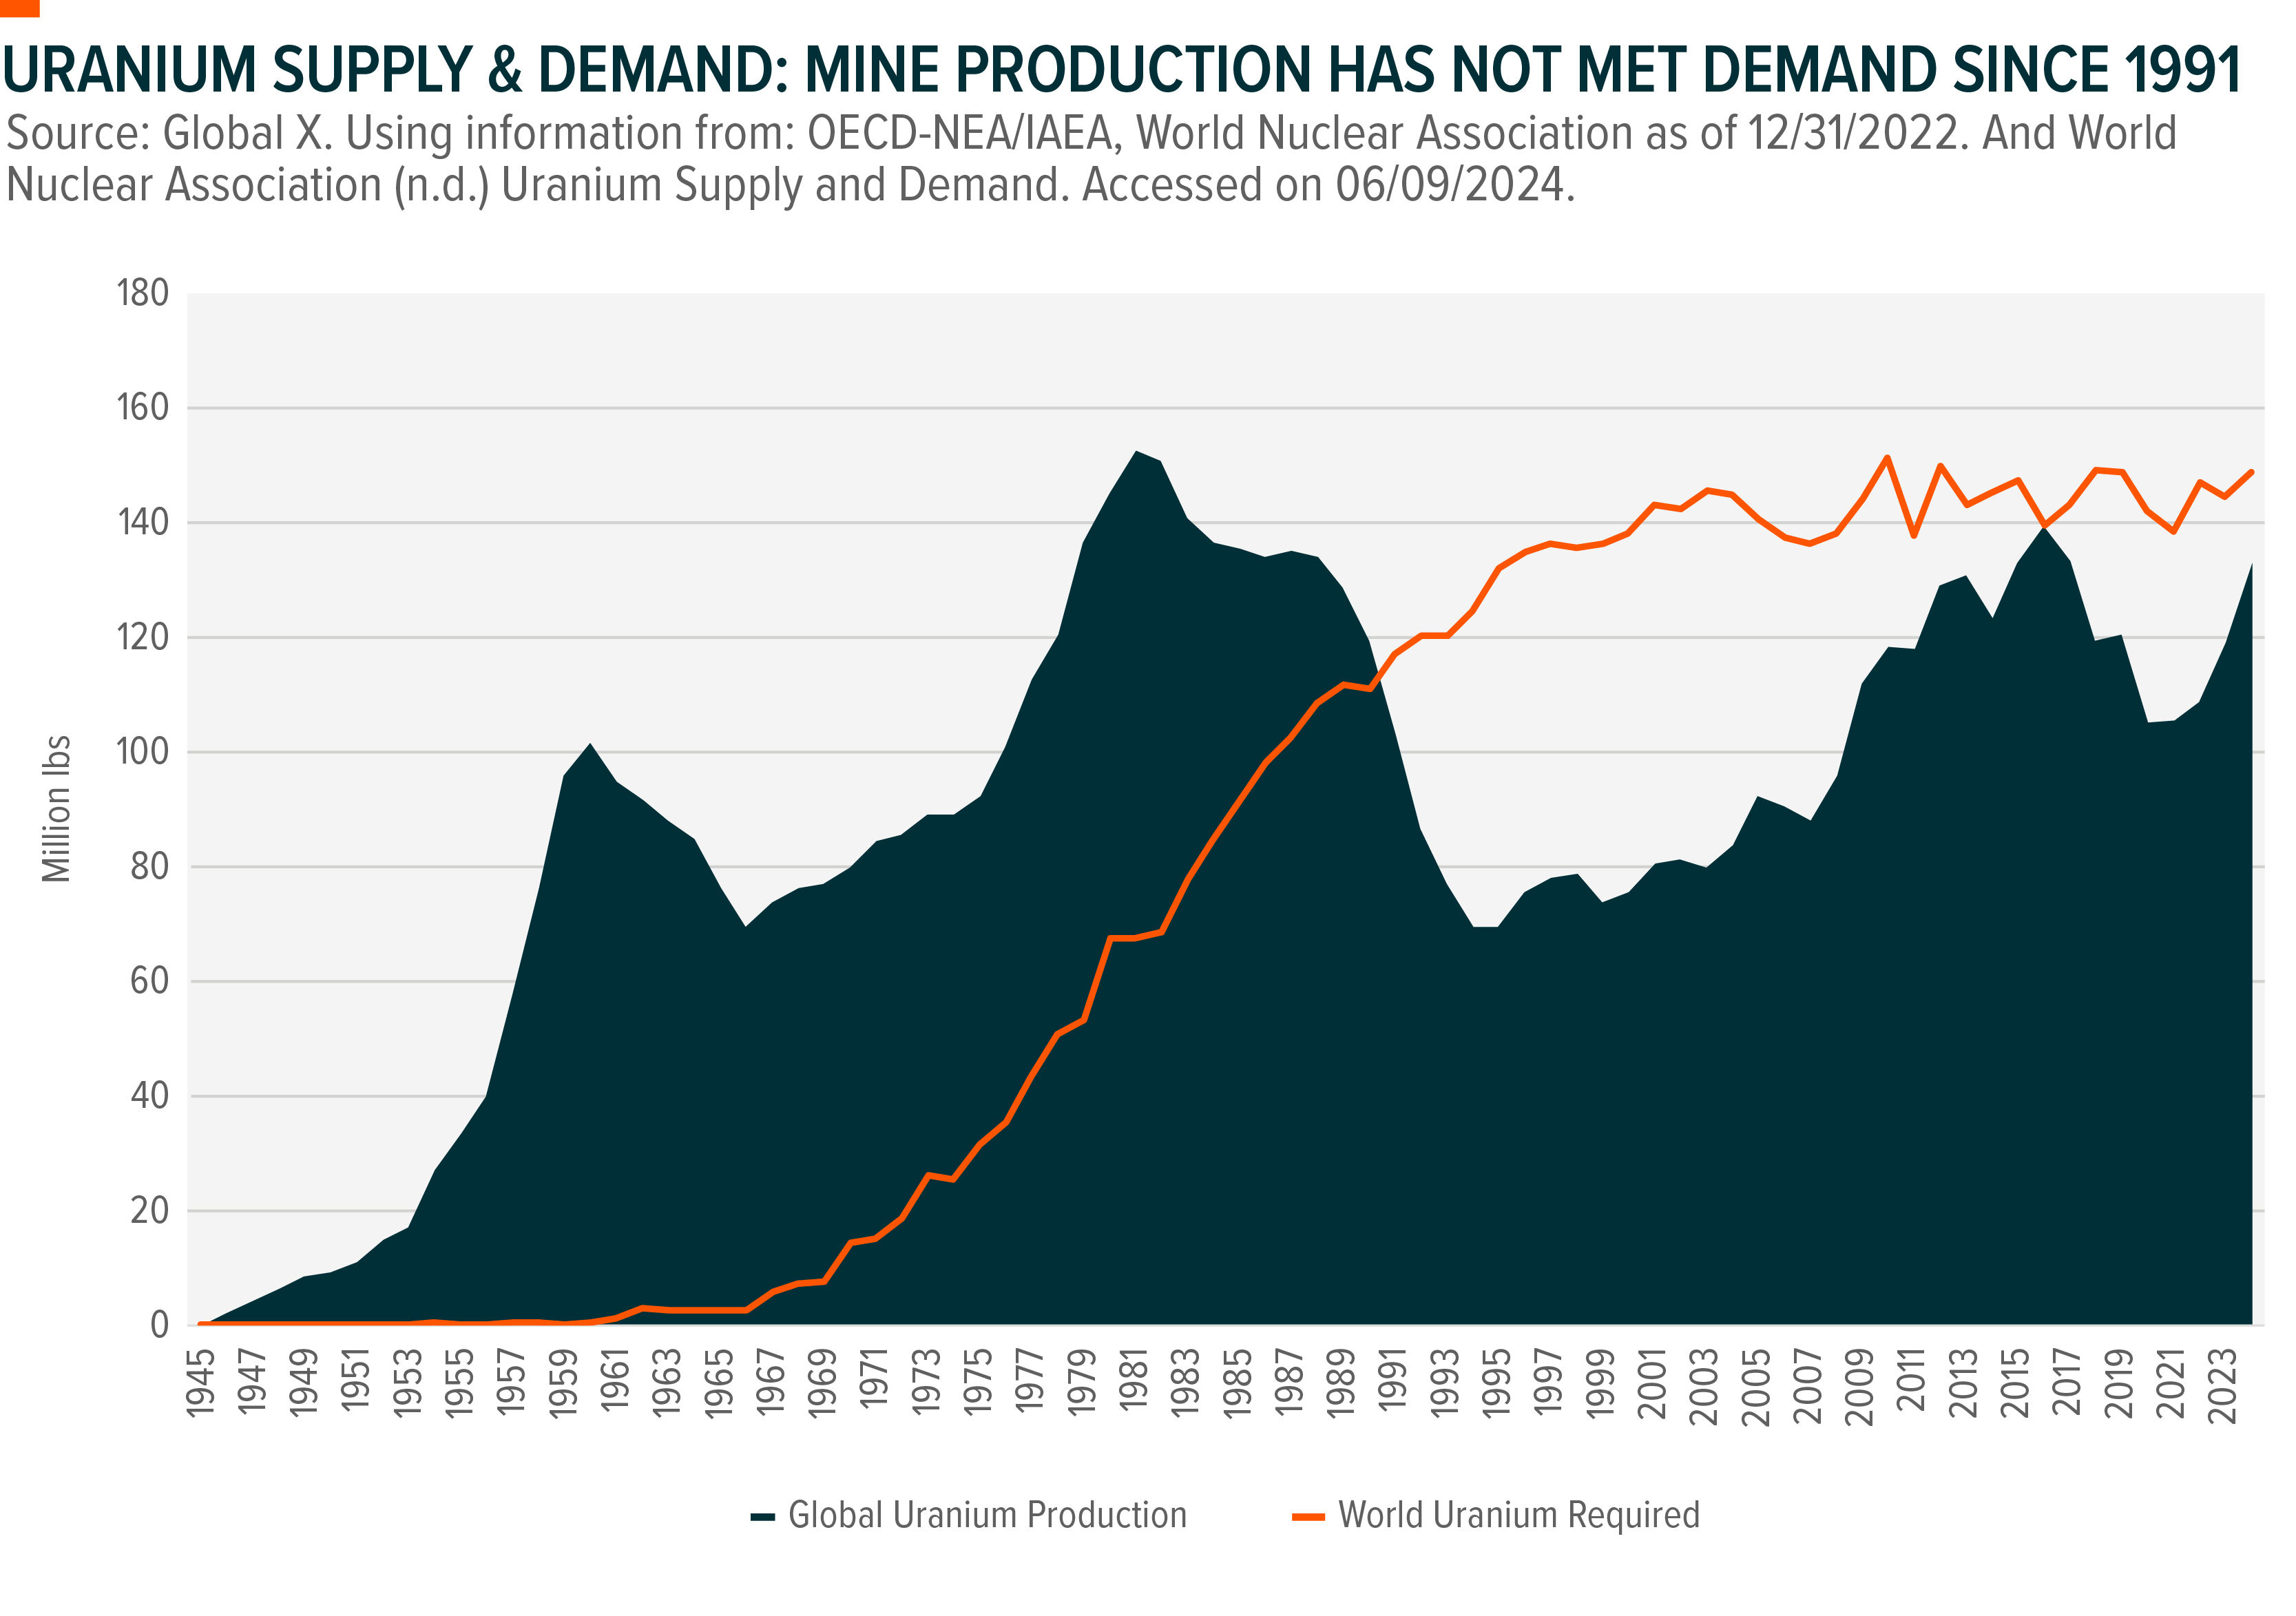
The US Department of Energy sold its own UF6 inventory into the market during the same period. Between military stockpile liquidation and the original overproduction overhang, primary uranium mining was competing against its own past for three decades. Primary production has not matched annual uranium demand in any year for the past 30 years. The market ran on inventory.
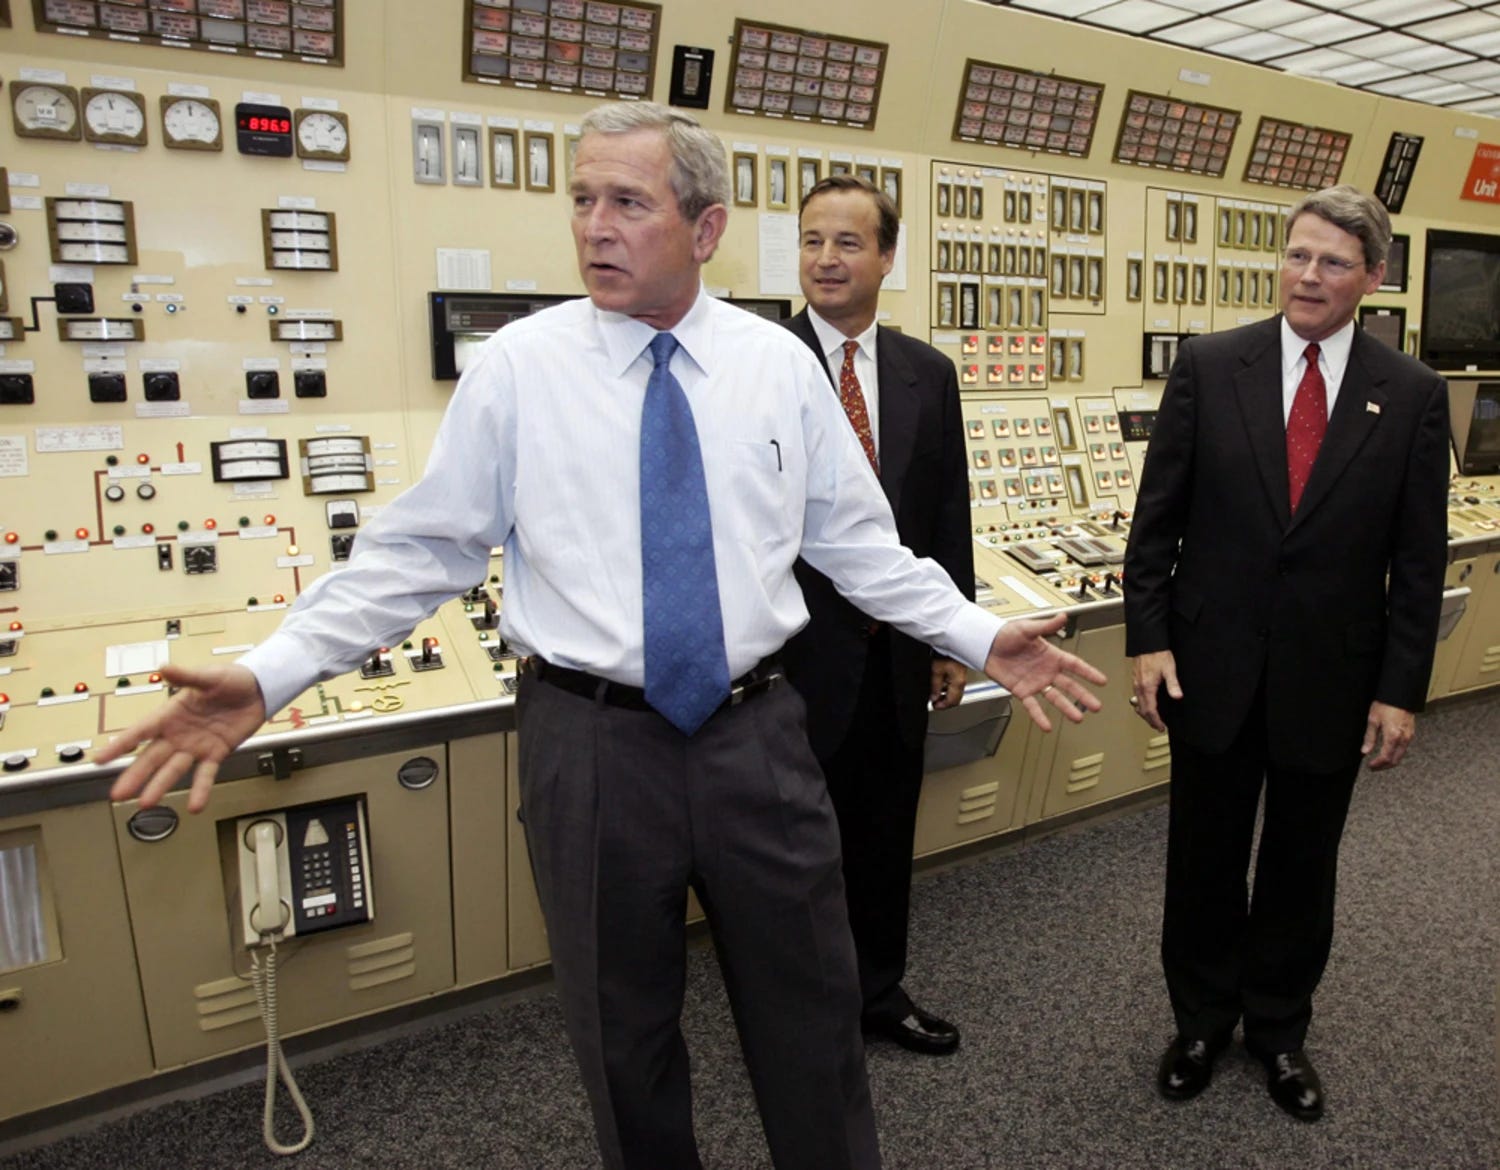
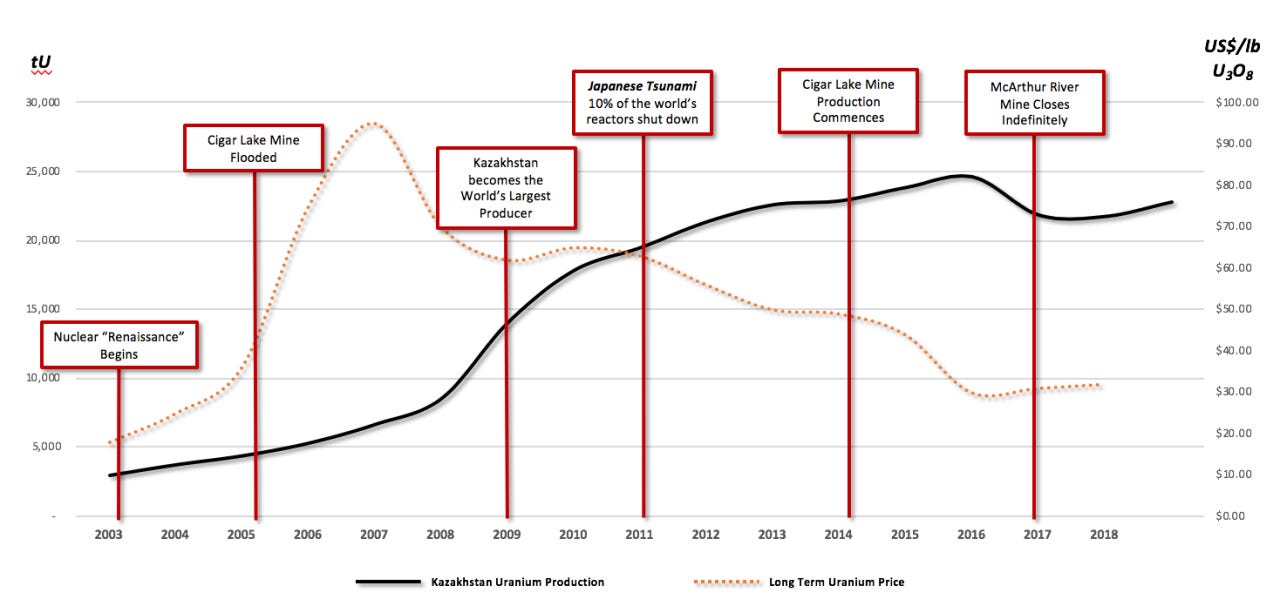
The 2000s brought the first bull market that looked like it might escape this pattern. Natural gas prices were rising, George W. Bush was at Calvert Cliffs announcing a nuclear renaissance. Generation III+ reactor designs were moving from paper to licensing and even record breaking construction schedules in Japan’s extraordinary ABWR buildout. Uranium moved from around $10 per pound in 2003 toward a $136 per pound peak in 2007, but the spike was driven less by actual demand contracting than by supply shock anxiety.
In 2003, a water inflow at McArthur River reminded the market that mining has risks that liquidating inventory does not. In 2006, the Cigar Lake development project flooded before it had produced a single pound; it was supposed to come online by 2009, and after the flood some in the market began to wonder whether Cigar Lake was simply unmineable. That fear, not a fundamental shift in contracting, drove the price to its 2007 peak.
Then in the summer of 2010, something demand-driven happened. China arrived in the term market and contracted 152 million pounds of uranium with Cameco, Kazatomprom, and Orano: nearly a year’s worth of total global demand, with deliveries running from 2015 into the early 2020s. Traditional western utilities, watching the scale of sovereign Chinese buying, suddenly recalculated their own forward exposure and tried to go through the contracting door simultaneously. The price was heading toward another high when, in March 2011, a tsunami hit the Japanese coastline and disabled the Fukushima Daiichi plant.
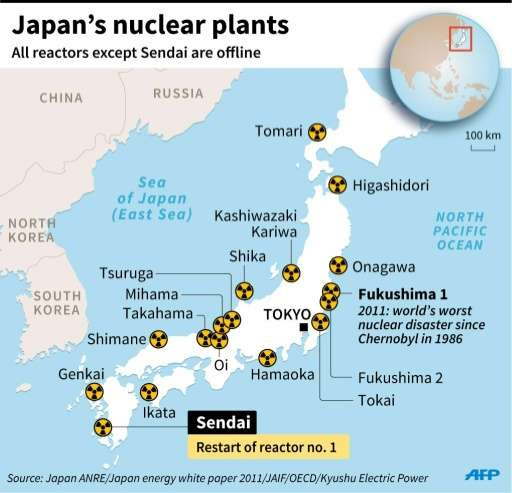
Japan shut down all 50 of its operating reactors, removing roughly 10% of global uranium demand almost overnight. Japan had already contracted years ahead for uranium it now did not need, and that material began finding its way back into the spot market.
Kazatomprom, operating at low marginal cost through ISL and carrying the production volumes it had built up during the bull, kept producing regardless. With no contracting discipline and no floor under which it would reduce output, Kazakhstan jammed surplus pounds through the spot market continuously.
The price collapsed from around $80 per pound to a trough of $17.75, the level at which Cameco finally curtailed MacArthur River and Key Lake in 2018 after a series of earlier partial reductions, by which point Cameco had 70% of its production shut in.
The company bought cheap spot material to fulfil its contracted sales portfolio and limited losses on the spread, even as care-and-maintenance costs at the idled operations ran $7 to $9 million a month. The spot material it was purchasing was largely Kazakh in origin, the same overproduction that had broken the price in the first place.
Kazakhstan’s behavior during this period carries a lesson the market has since absorbed. By producing at maximum volume through a collapsing price environment, Kazatomprom succeeded in becoming the world’s largest producer of a commodity it had completely devalued. The dividend it owed to the Kazakh state shrank in proportion to the price it had helped destroy.
The parallel to a Gulf petro-state that pumps aggressively into a falling oil market and discovers it has liquidated a national asset at the bottom of the cycle is fitting. Saudi Arabia took several such cycles to internalize the value of spare capacity and price management. Kazakhstan absorbed one catastrophic bear market and drew the correct conclusion faster. Its strategy today is indistinguishable from Cameco’s: contract first, produce after, treat in-ground uranium as inventory with value rather than as a cost to be minimized by maximizing throughput.
What every cycle in this history shares is the secondary supply wedge functioning as both cushion and amplifier. On the way down, secondary supply floods the market and extends the bear beyond what primary economics alone would produce. On the way up, the existence of that potential secondary supply caps the price signal that would otherwise incentivize new primary investment. For 6 decades the wedge was always there. That is no longer the case.
The Cold War stockpiles are gone, the megatons-to-megawatts program concluded in 2013, and utility inventories, while still meaningful, are working stocks rather than the vast strategic overhangs of earlier eras. The market emerging from this bear is the first in the modern history of the industry that has to be balanced by primary production alone.
The market entering this bull is the first in the modern history of the industry that has to be balanced by primary production alone, from producers who have learned, through painful experience, exactly what happens when they do not exercise discipline over their own output.
Next week, the second part of this analysis examines what that structural shift actually means in practice: how the two largest uranium producers in the world are now running explicit supply restraint simultaneously, why the geopolitical fracturing of the global uranium market is creating two separate procurement realities rather than one, and why the demand picture building against this constrained supply base is different in kind from any previous nuclear renaissance story.
The pattern that ended every prior uranium bull is structurally less available in this cycle. Understanding why requires understanding what has changed on both sides of the ledger at once.
Like this post or we’ll shut down the comment section until sentiment improves.
Nice article. Thank you.
Great article. Best that i have read on uranium